 Anatomy of a Web Map
3 exceptions to yesterday's simplified story!
Exception #1: Can’t interact with many features on a raster. BUT
UTFGrid (Mapbox invention) makes it possible.
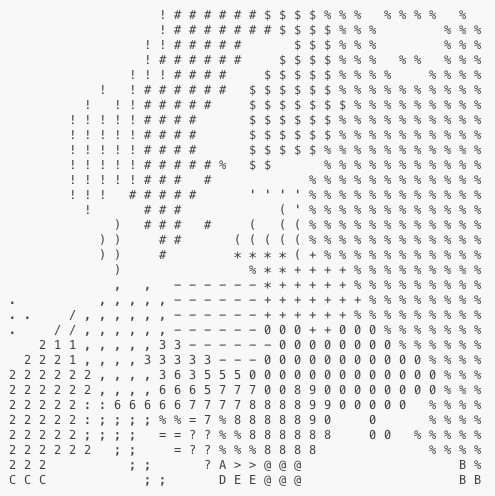
UTFGrid is an invisble tile layer made up of arbitrary letters which are indexes into the clickable data
Exception #2: Tiles are always rasters except when they're not!
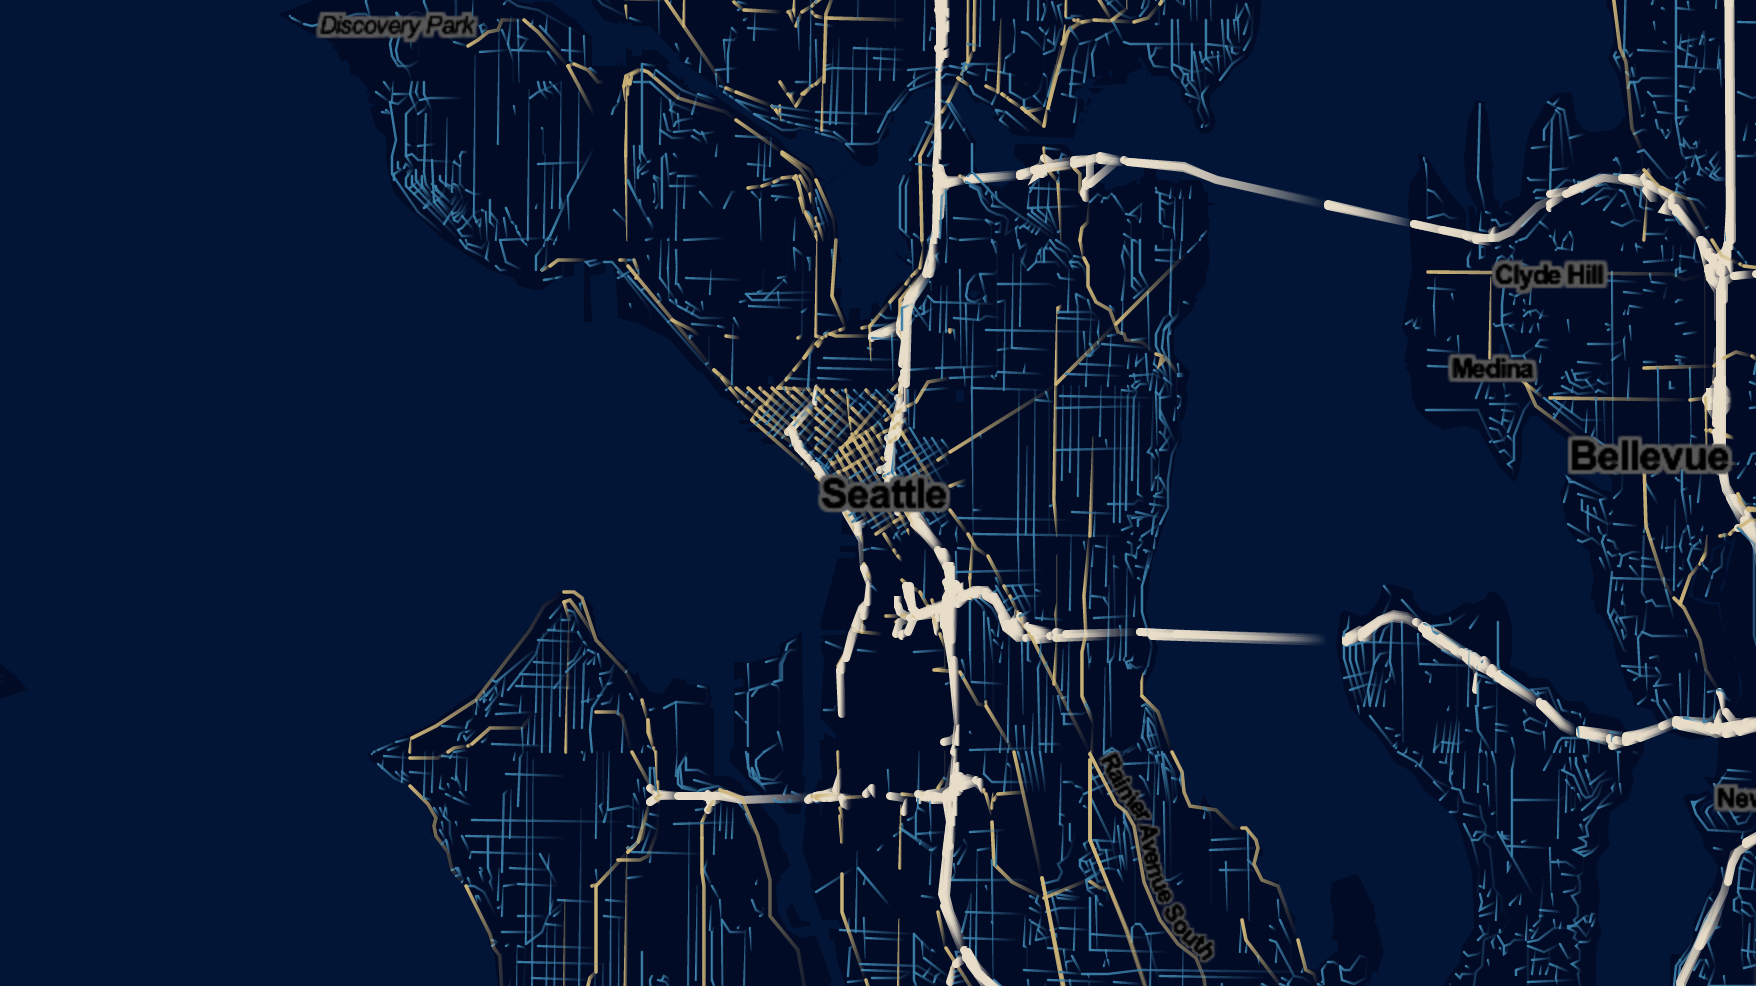 vector tiles!
 What are they?
vector tiles: they are an alternative to a database that makes raster tiles.
Raster: ask for data to fit into tile - burned
Vector: already have vector data sliced up in the way that I will make raster tiles
So someone has to go through and chop up that data, like
MapBox or yourself
Advantages:
Styling - can be styled when requested, allowing for many map styles on global data
Size - really small, enabling global high resolution maps, fast map loads, and efficient caching
Dynamicity - client side filtering/querying and zoom dependent styling
Scalability - WebGL works on the graphic card
Disdvantages:
WebGL - not every browser has full support yet
Complexity - still a bit complex to use
Ecuador sample data:
1015 districts (admin level 2)
33 attributes (per district)
500,000 vertices
Loading from local GeoJson: 1.62 s
Loading protocol buffer from TileLive: 161 ms
Exception #3:
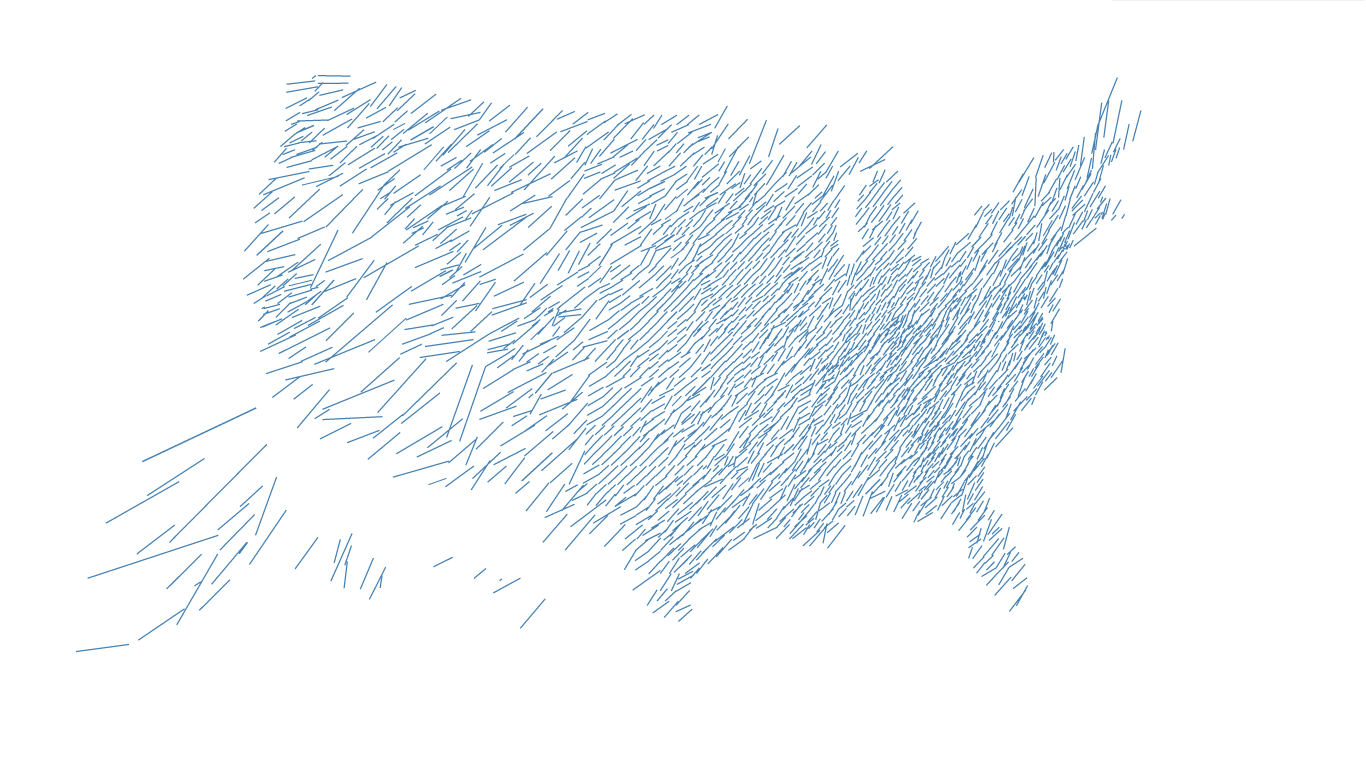
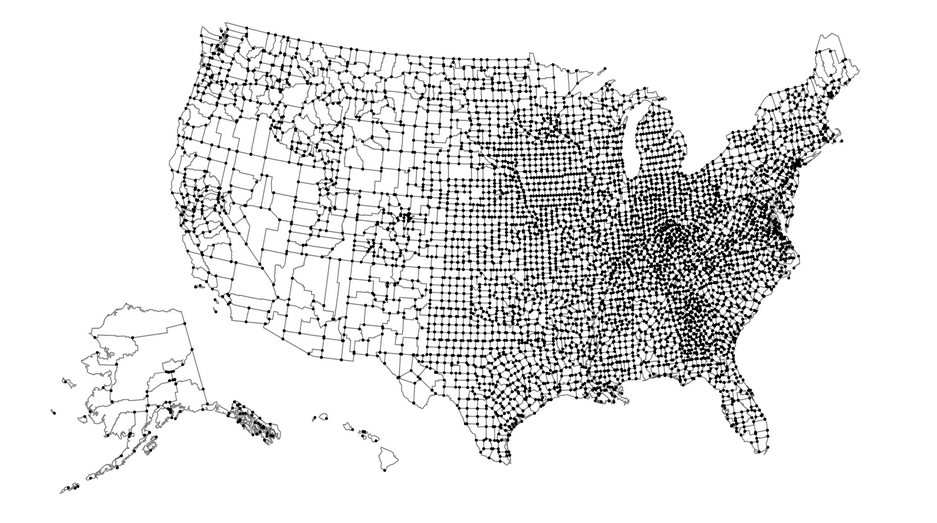
D3 exists outside the world of tiles
you can’t easily make road map in D3 BUT can do things that are clumsy in slippy maps like...
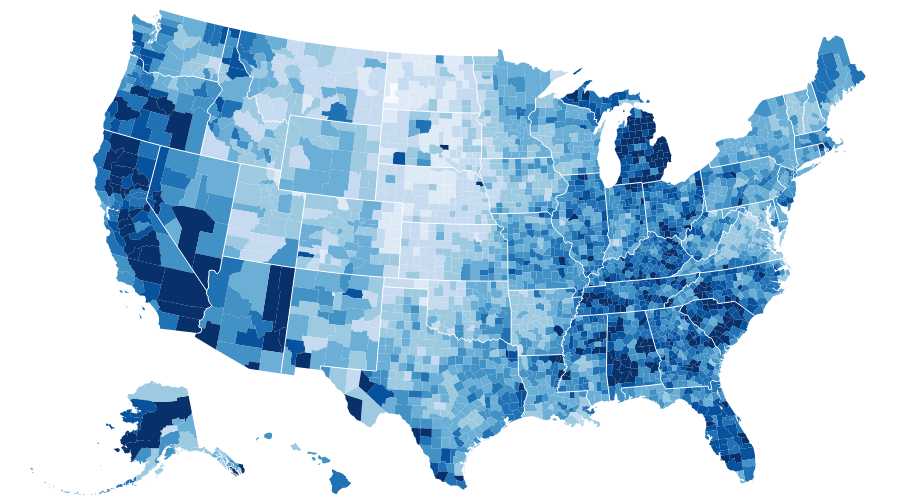
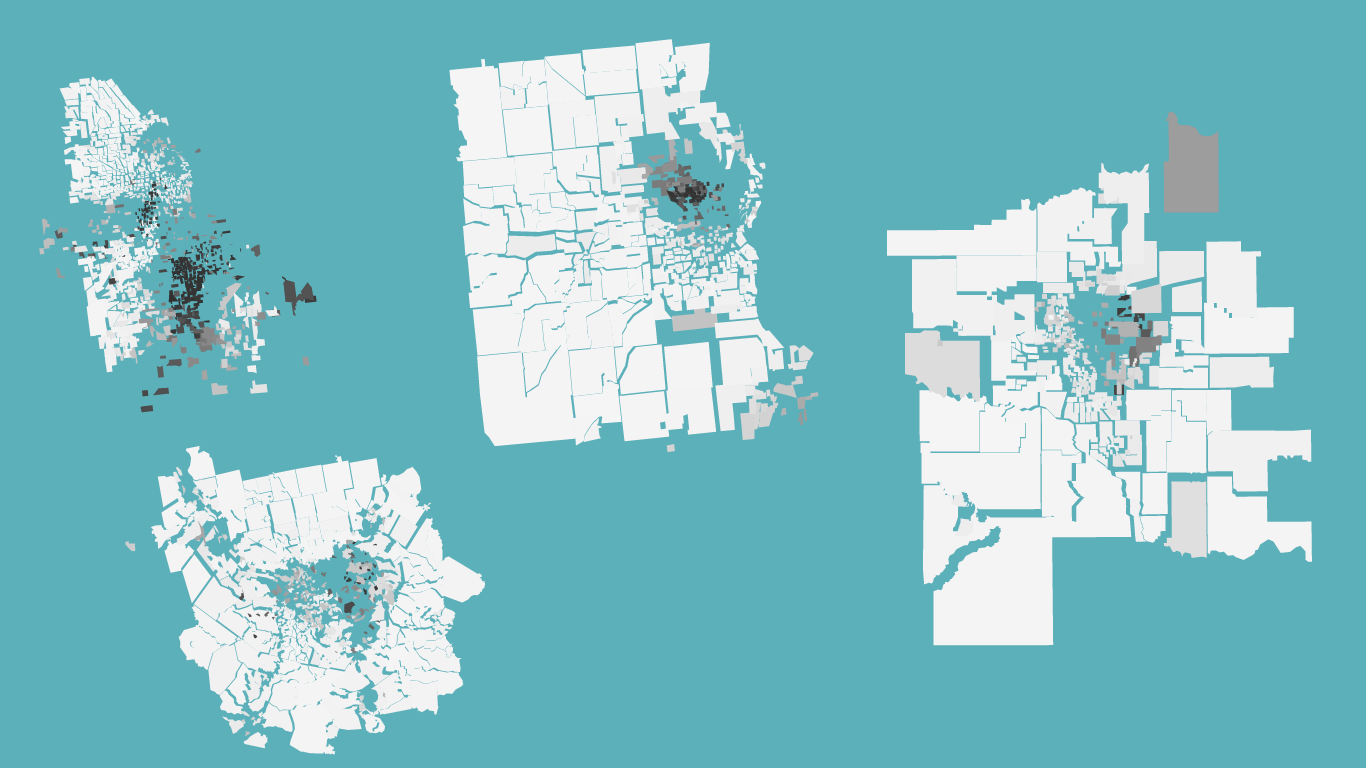
choropleth maps
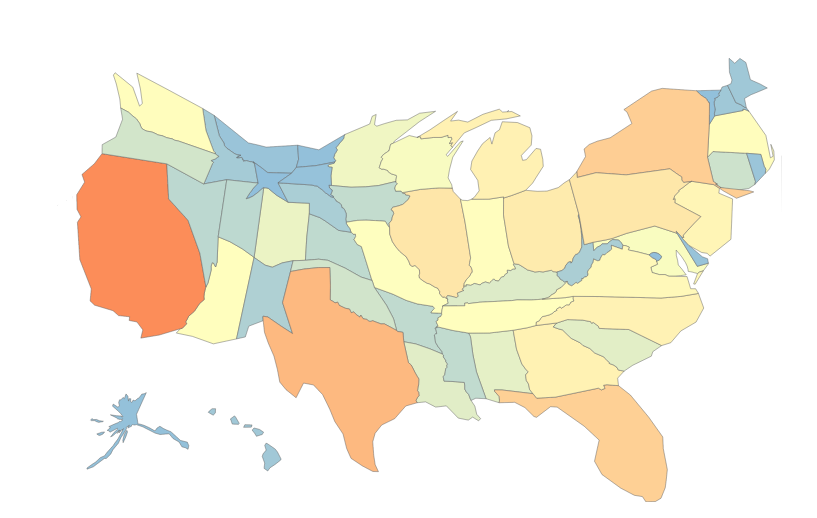
cartograms
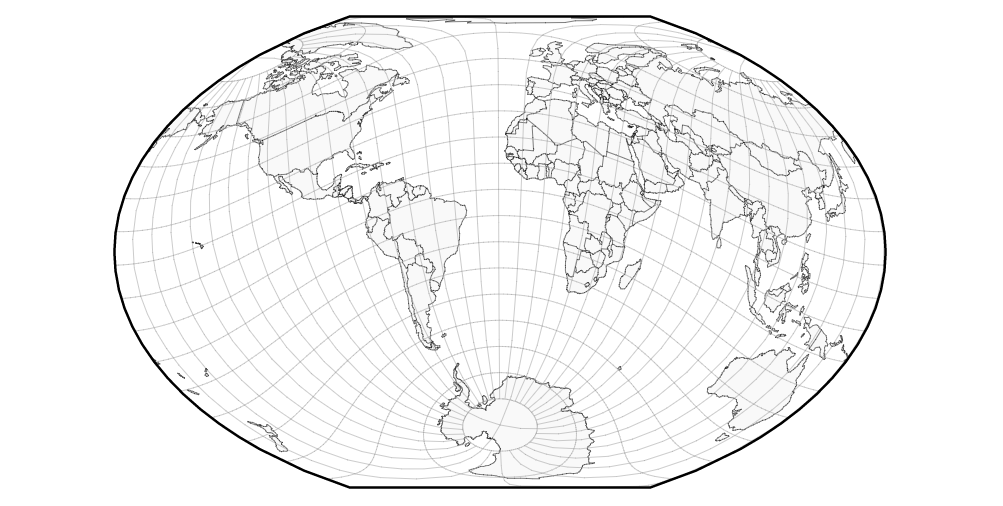
different map projections (in the browser!)
D3
IS
IN
SANE
Very powerful, but steepish learning curve
Postgis is a spatial database extender for PostgreSQL object-relational database.
Geoserver is an open source server for sharing geospatial data
Geonode is an Open Source Geospatial Content Management System